
Delayed spring activity boosts supply of property listings in the Region
EASTERN FRASER VALLEY, BC – June 6, 2023
At 1,771 new listings were up 44% over the prior month's total of 1,230 and just below May 2022 levels of 1,884. A welcome trend towards alleviating housing supply issues.
"Typically we would see an influx of inventory earlier in the spring sales cycle," said Narinder Bains, Chair of the Fraser Valley Real Estate Board. "The series of interest rate hikes during the latter half of 2022 had many sellers and buyers in a holding pattern for most of the year. What we're seeing now is a recovery and adjustment to the new financing landscape."
The strong supply trend was met with healthy demand. In May, we saw a 22.4% increase in unit sales up to 1,053 from 860 the prior month. This was also up 46.0% from May of 2022 causing the active listings to remaining stable at 2,394. These active listings are still down 28.6% from 3,353 active listings in May of 2022.
As buyer confidence grew, prices continued to edge upward across most of the regions. Compared to April of 2023, Abbotsford was up 4.6%, Chilliwack and Area 3.0% and Langley 0.9% with Mission showing a decline of 3.9% mainly due to a correction from March of 2023.
"It's encouraging to see more typically cyclical activity this spring," said FVREB CEO, Baldev Gill. "Inventory has been trending upwards since December 2022, providing more choice, which in turn will hopefully spur on even more listings. That said, with inflation tracking at elevated levels the potential for further rate hikes is very real. Buyers and sellers would be well-advised to work with real estate professionals to factor this into their decisions."
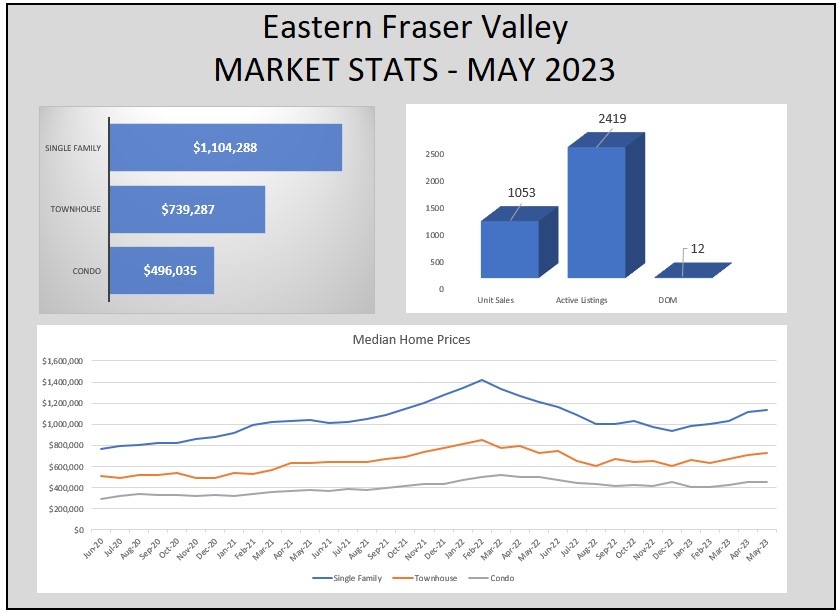
Across the Region in May, properties continued to move more quickly with each passing month: Abbotsford homes, on average took 9 days to sell; Langley homes took an average of 8 day, Mission 18 day and Chilliwack and district 13 days resulting in an average of 12 days across the region. This is down from the 2023 peak in January that had an average of 36 days on the market.
MONTHS OF INVENTORY
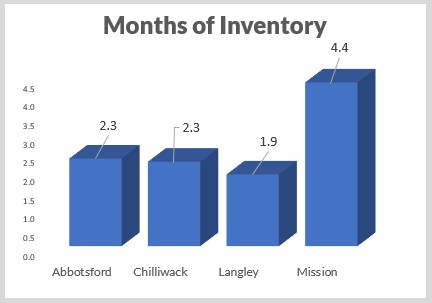
Months of Inventory are a strong indication of how robust the market is.
- 0 to 5 months of inventory = "seller's market".
- 5 and 8 months of inventory = "Balanced Market".
- More than 8 months of inventory = "Buyer's Market".
Analysis of the historical data suggests downward pressure on home prices occurs when the ratio rises above 8 months of inventory for a sustained period, while home prices often experience upward pressure when it dips below 5 over several months.
ABBOTSFORD

The average price for all residential properties in Abbotsford is currently $793,891 This represents a 4.6% increase over the prior month and 4.5% decrease compared to the same month last year.
DETATCHED HOMES
Sales of detached homes in May 2023 reached 95 up from 87 the prior month and 72 the same month last year (increases of 9.2% and 31.9% respectively. The average sales price for detached properties in Abbotsford was $1,238,780 which is up 6.9% from the prior month and down 4.5% compared to the same month last year.
We saw 240 new listings this month which is up from 137 last month and up from 209 compared to the same month last year.
Active listings were at 340, which is up from 263 from last month and down from 489 the same month last year.
TOWNHOMES AND ROWHOMES
We saw 74 of these types of homes sell this month. This is up from 54 the prior month and 38 the same month the prior year (up 37% and 94.7% respectively). The average price of these attached units is $698,590. This represents a 6.2% increase over the prior month and a 2.7% decrease compared to the same month last year.
We saw 92 new listings this month which is up from 79 last month and down from 106 compared to the same month last year.
Active listings were at 108, which is down from 114 last month and down from 202 the same month last year.
CONDOS AND APPARTMENTS
We saw 93 of these types of homes sell this month. This is up from 86 the prior month and 61 the same month the prior year (up 8.1% and 52.5% respectively). The average price of these homes is $415,266. This represents a -0.5% change over the prior month and a -10.6% decrease compared to the same month last year.
We saw 128 new listings this month which is up from 101 last month and down from 154 compared to the same month last year.
Active listings were at 164, down from 167 and 223 last month and last year respectively.
CHILLIWACK

The average price for all residential properties in Chilliwack is currently $744,602 This represents a 3.0% increase over the prior month and 4.8% decrease compared to the same month last year.
DETATCHED HOMES
Sales of detached homes in May 2023 reached 225 up from 157 the prior month and 115 the same month last year (increases of 43.3% and 95.7% respectively. The average sales price for detached properties in Abbotsford was $868,720 which is up 2.3% from the prior month and down 9.7% compared to the same month last year.
We saw 348 new listings this month which is up from 275 last month and down from 420 compared to the same month last year.
Active listings were at 529, which is down from 539 from the prior month and down from 832 the same month last year.
TOWNHOMES AND ROWHOMES
We saw 82 of these types of homes sell this month. This is up from 61 the prior month and 45 the same month the prior year (up 34.4% and 82.2% respectively). The average price of these attached units is $602,492. This represents a 1.0% decrease over the prior month and a 6.2% decrease compared to the same month last year.
We saw 92 new listings this month which is up from 66 last month and down from 108 compared to the same month last year.
Active listings were at 107, which is down from 134 last month and down from 194 the same month last year.
CONDOS AND APPARTMENTS
We saw 48 of these types of homes sell this month. This is up from 42 the prior month and the same month the prior year (up 14.3%). The average price of these homes is $405,571. This represents a -2.2% change over the prior month and a -8.1% decrease compared to the same month last year.
We saw 87 new listings this month which is up from 69 last month and down from 95 compared to the same month last year.
Active listings were at 163, up from 154 last month and virtually the same at 162 last year.
LANGLEY

The average price for all residential properties in Langley is currently $965,869. This represents a 0.9% increase over the prior month and 3.8% decrease compared to the same month last year.
DETATCHED HOMES
Sales of detached homes in May 2023 reached 123 up from 105 the prior month and 98 the same month last year (increases of 17.1% and 25.5% respectively. The average sales price for detached properties in Abbotsford was $1,490,485 which is up 1.4% from the prior month and down 3.5% compared to the same month last year.
We saw 268 new listings this month which is up from 155 last month and up from 253 compared to the same month last year.
Active listings were at 341, which is up from 248 from the prior month and down from 431 the same month last year.
TOWNHOMES AND ROWHOMES
We saw 93 of these types of homes sell this month. This is slightly down from 94 the prior month and up from 80 the same month the prior year ( -1.1% and +16.3% respectively). The average price of these attached units is $896,855. This represents a 6.1% increase over the prior month and a 1.2% decrease compared to the same month last year.
We saw 144 new listings this month which is up from 99 last month and down from 196 compared to the same month last year.
Active listings were at 132, which is up from 104 last month and down from 243 the same month last year.
CONDOS AND APPARTMENTS
We saw 149 of these types of homes sell this month. This is up from 117 the prior month and 110 the same month the prior year (up 27.4% and 35.5% respectively). The average price of these homes is $575,872. This represents a -1.8% change over the prior month and a -2.9% decrease compared to the same month last year.
We saw 201 new listings this month which is up from 152 last month and up from 197 compared to the same month last year.
Active listings were at 225, down from 243 last month and 267 the same month last year.
MISSION

The average price for all residential properties in Mission is currently $911,261. This represents a -3.9% decrease over the prior month and -5.6% decrease compared to the same month last year.
DETATCHED HOMES
Sales of detached homes in May 2023 reached 56 up from 41 the prior month and 47 the same month last year (increases of 36.6% and 19.1% respectively. The average sales price for detached properties in Abbotsford was $974,353 which is down 9.0% from the prior month and down 8.3% compared to the same month last year.
We saw 143 new listings this month which is up from 65 last month and up from 121 compared to the same month last year.
Active listings were at 217, which is up from 168 from the prior month and down from 263 the same month last year.
TOWNHOMES AND ROWHOMES
We saw 13 of these types of homes sell this month. This is slightly up from 10 the prior month and up from 7 the same month the prior year ( 30% and 85.7% respectively). The average price of these attached units is $706,596. This represents a -2.1% decrease over the prior month and a 6.5% increase compared to the same month last year.
We saw 13 new listings this month which is down from 14 last month and up from 11 compared to the same month last year.
Active listings were at 21, which is the same as 21 last month and down 1 from 22 the same month last year.
CONDOS AND APPARTMENTS
We saw 2 of these types of homes sell this month. This is down from 6 both the prior month and the same month the prior year (-66.7%). The average price of these homes is $475,000. This represents a -3.4% change over the prior month and a -15.4% decrease compared to the same month last year.
We saw 15 new listings this month which is down from 18 last month and up from 14 compared to the same month last year.
Active listings were at 47, up from 39 last month and 25 the same month last year.
Buying or Selling? Free home valuation and/or consultation
I look forward to working with you and helping you reach your home ownership goals. Reach out to get in touch and start the process today. I offer:
