
Delayed spring activity boosts supply of property listings in the Region
EASTERN FRASER VALLEY, BC – June 6, 2023
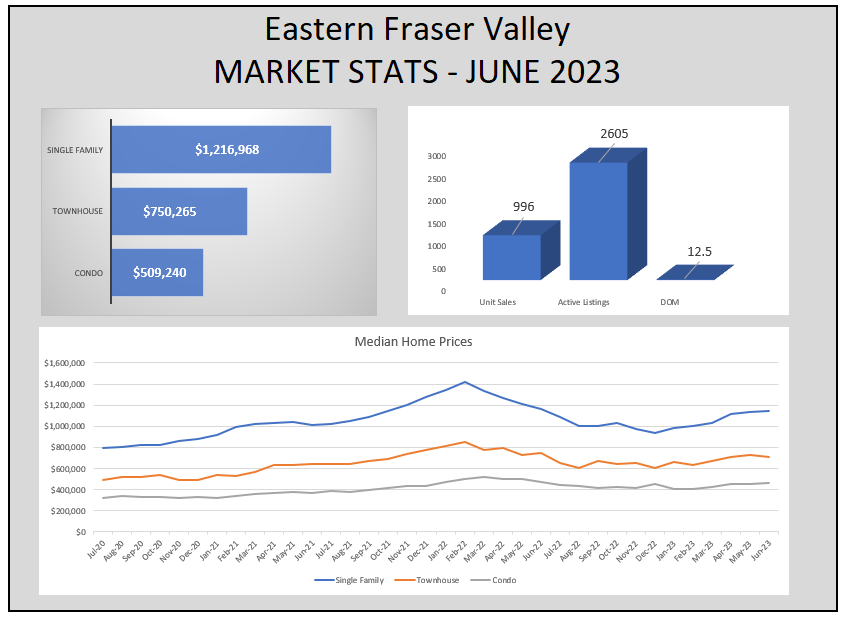
The Eastern Fraser Valley real estate market saw strong sales activity in June with levels on par with the 10-year average for the month, amid on-going challenges with supply.
In June, the market registered 996 sales on its Multiple Listing
Service® (MLS®). Although down 5.4% over May of 2023 it was a significant increase of 60.6% compared to June 2022.
“As seen in recent months, prices continue to trend slightly upward, with lack of supply and high demand for housing. We seem to be seeing sales
increasing, with buyers entering the market despite current financial implications of rate hikes.”
There were 1,632 new listings in June, down 9.9% compared to last year, and 7.8% compared to May 2023. but on par with the 10 year average of 1,631.
The month ended with a total active inventory of 2,589 an 8.1% increase compared to May, but a 29.5% decrease of June of 2023 and 29.3% decrease from the 10 year average.
“A number of factors are at play in the Fraser Valley market, from low supply to unprecedented interest rates – the highest in more than 20 years,” said Board CEO, Baldev Gill.
Across the region in June, the average number of days to sell a single-family detached home was 12.5 days.
MONTHS OF INVENTORY
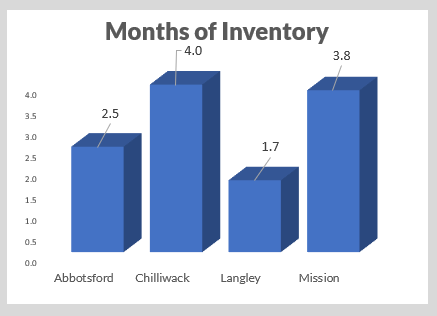
Months of Inventory are a strong indication of how robust the market is.
- 0 to 5 months of inventory = "seller's market".
- 5 and 8 months of inventory = "Balanced Market".
- More than 8 months of inventory = "Buyer's Market".
Analysis of the historical data suggests downward pressure on home prices occurs when the ratio rises above 8 months of inventory for a sustained period, while home prices often experience upward pressure when it dips below 5 over several months.
ABBOTSFORD

The average price for all residential properties in Abbotsford is currently $808,522 This represents a 7.1% increase over the prior month and 5.2% increase compared to the same month last year.
DETATCHED HOMES
Sales of detached homes in this month reached 103 up from 95 the prior month and 58 the same month last year (increases of 8.4% and 77.6% respectively. The average sales price for detached properties in Abbotsford was $1,265,519 which is up 2.2% from the prior month and down 0.7% compared to the same month last year.
We saw 234 new detached home listings this month which is slightly down from 240 last month and up from 190 compared to the same month last year.
Active listings were at 405, which is up from 340 from last month but down from 500 the same month last year.
TOWNHOMES AND ROWHOMES
We saw 66 of these types of homes sell this month. This is down from 74 the prior month but up from 38 the same month the prior year.
There were 87 new Townhome listings this month which is down from 92 last month and 104 last year.
The month ended with 115 active listings which is slightly up from 108 last month but significantly down from 210 this month last year.
The average sales price was $668,001, down 4.4% from last month and 8.6% from last year.
CONDOS AND APPARTMENTS
160 of these types of homes sold this month compared to 164 last month and 261 last year.
We saw 140 new listings this month compared to 128 last month and 152 last year.
We ended the month with 160 active listings compared to 164 last month and 261 last year.
The average price of these homes is $441,567 up 6.3% from last month and down 5.4% compared to last year.
CHILLIWACK

The average price for all residential properties in Chilliwack is currently $750,836 This represents a 0.8% increase over the prior month and 5.6% increase compared to the same month last year.
DETATCHED HOMES
Sales of detached homes this month reached 130 down from 225 last month and up from 86 last year.
We saw 312 new detached home listed this month compared to 348 last month 368 last year.
Active listings were at 608 at the end of the month compared to 529 the previous month and 883 the same month last year.
The average sales price for detached properties in Chilliwack was $896,425 which is up 3.2% from the prior month and down 0.4% compared to the same month last year.
TOWNHOMES AND ROWHOMES
We saw 60 of these types of homes sell this month compared to 82 last month and 43 last year.
There were 78 new Townhome listed this month compared to 92 last month and 120 last year.
The month ended with 107 active listings which is the same as last month and significantly down from 216 this month last year.
The average sales price was $591,628, down 1.8% from last month and 7.5% from last year.
CONDOS AND APPARTMENTS
34 of these types of homes sold this month compared to 48 last month and 40 last year.
We saw 66 new listings this month compared to 87 last month and 98 last year.
We ended the month with 175 active listings compared to 163 last month and 184 last year.
The average price of these homes is $475,126 up 17.1% from last month and 20.2% compared to last year.
LANGLEY

The average price for all residential properties in Langley is currently $1,060,532 This represents a 9.8% increase over the prior month and 12.0% increase compared to the same month last year.
DETATCHED HOMES
Sales of detached homes this month reached 174 up from 123 last month and 71 last year.
We saw 243 new detached home listed this month compared to 268 last month 223 last year.
Active listings were at 348 at the end of the month compared to 341 the previous month and 490 the same month last year.
The average sales price for detached properties in Langley was $1,534,257 which is up 2.9% from the prior month and 3.2% compared to the same month last year.
TOWNHOMES AND ROWHOMES
We saw 107 of these types of homes sell this month compared to 93 last month and 90 last year.
There were 132 new Townhome listed this month compared to 132 last month and 202 last year.
The month ended with 132 active listings compared to 284 this month last year.
The average sales price was $899,328, up 0.3% from last month and 1.4% from last year.
CONDOS AND APPARTMENTS
34 of these types of homes sold this month compared to 48 last month and 40 last year.
We saw 66 new listings this month compared to 87 last month and 98 last year.
We ended the month with 175 active listings compared to 163 last month and 184 last year.
The average price of these homes is $579,719 down 0.9% from last month and 1.6% compared to last year.
MISSION

The average price for all residential properties in Mission is currently $911,261. This represents a -3.9% decrease over the prior month and -5.6% decrease compared to the same month last year.
DETATCHED HOMES
Sales of detached homes in May 2023 reached 56 up from 41 the prior month and 47 the same month last year (increases of 36.6% and 19.1% respectively. The average sales price for detached properties in Abbotsford was $974,353 which is down 9.0% from the prior month and down 8.3% compared to the same month last year.
We saw 143 new listings this month which is up from 65 last month and up from 121 compared to the same month last year.
Active listings were at 217, which is up from 168 from the prior month and down from 263 the same month last year.
TOWNHOMES AND ROWHOMES
We saw 13 of these types of homes sell this month. This is slightly up from 10 the prior month and up from 7 the same month the prior year ( 30% and 85.7% respectively). The average price of these attached units is $706,596. This represents a -2.1% decrease over the prior month and a 6.5% increase compared to the same month last year.
We saw 13 new listings this month which is down from 14 last month and up from 11 compared to the same month last year.
Active listings were at 21, which is the same as 21 last month and down 1 from 22 the same month last year.
CONDOS AND APPARTMENTS
We saw 2 of these types of homes sell this month. This is down from 6 both the prior month and the same month the prior year (-66.7%). The average price of these homes is $475,000. This represents a -3.4% change over the prior month and a -15.4% decrease compared to the same month last year.
We saw 15 new listings this month which is down from 18 last month and up from 14 compared to the same month last year.
Active listings were at 47, up from 39 last month and 25 the same month last year.
Buying or Selling? Free home valuation and/or consultation
I look forward to working with you and helping you reach your home ownership goals. Reach out to get in touch and start the process today. I offer:
