
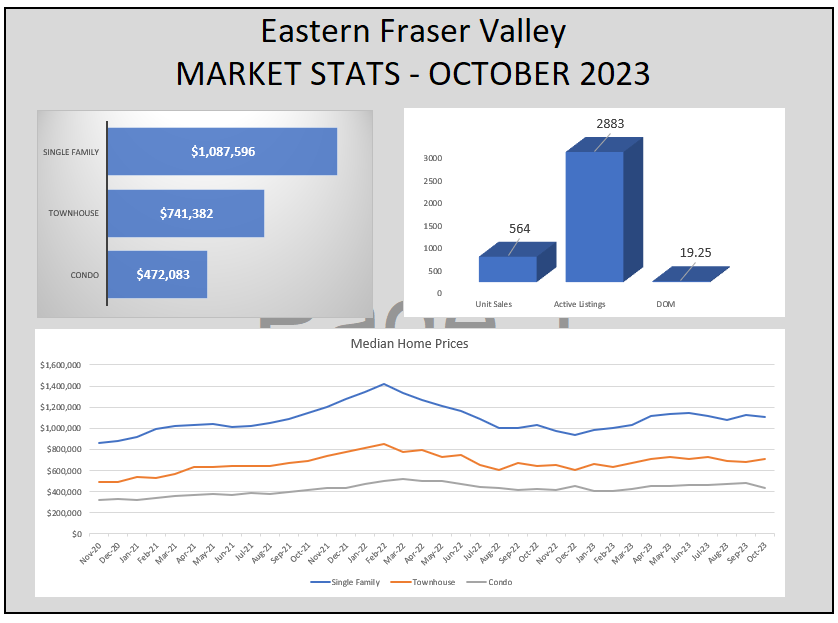
- Single Family Detached: At $1,087,596 the Median price for a single-family detached home decreased 1.2 per cent compared to the prior month and up 2.5% per cent compared to the same month in 2022.
- Townhomes: At $741,382, the Median price for a townhome increased 5.1 per cent compared to the prior month and up 12.9% compared to the same month 2022.
- Apartments/Condos: At $472,083, the Median price for a apartment/condo was down 7.3% compared to the prior month and up 1.8% compared to the same month in 2022.
Seasonality and interest rates affect sales in the Eastern Fraser Valley
EASTERN FRASER VALLEY, BC – November 6, 2023
The Eastern Fraser Valley real estate market softens due to a combination of seasonality and elevated interest rates.
OVERVIEW
Traditionally we see the unit sales decline from its seasonal peak of the spring and summer months with a decline starting in the fall until it bottoms in December and January after which the rise starts towards the spring market.
The market for October is showing a similar trend as unit sales are down from September. However, when we look at total unit sales being down 30.4% from the 10 year average in October, it's clear that consumers have continued to put home buying on hold in the face of elevated interest rates.
Over the last number of months, even with the lower unit sales, the number of active listings has remained low allowing the market to be at the upper end of a Seller's Market.
With seller's being more active and more listings coming on to the market (new listings up 10.8% from the 10-year average bringing the active listings on par with the 10-year average) we see the market move to more of a balanced condition in October.
Irrespective of all this, we know that home prices have been volatile over the past couple of years. Looking a wholistic picture over time however, home prices have increased a total of 48.1% in the past 5 years (from October of 2018 to October of 2023) for an average annual increase of 9.6% per year.
See below for some details and statistics.
AVERAGE HOME PRICE
Although the average home price declined by 2.1% last month compared to September's average price, in all regions with the exception of Mission, it was up over October of 2022 (Abbotsford 0.8%, Chilliwack 4.9% and Langley 6.3%).
AVERAGE HOME PRICES BY HOME TYPE:
UNIT SALES
Unit sales at 564 are down 6% from September and are up 18.7% over October 2022 but down 30.4% from October’s 10 year average of 810 home sales.
NEW LISTINGS
Although new listings, at 1202, fell from 1377 in September, decreasing by 11%, they are up 11.2% from October of 2022 and 10.8% from the 10 year average of 1087.
ACTIVE LISTINGS
Active listings at 2870 are on par with the 10 year average but down 6.6% from September and 12.2% from October 2022.
MARKET CONDITIONS
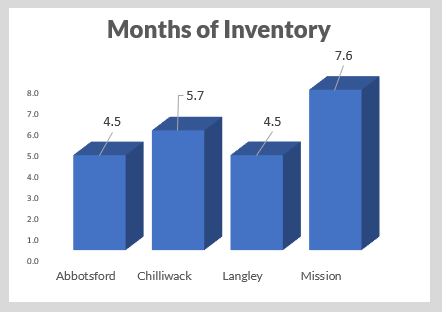
There is 5.01 months of inventory in the Easter Fraser Valley. This represents the entry into balanced conditions in the overall market. Mission and Chilliwack are driving the region into this range with 7.3 and 5.7 months of inventory respectively. Both Abbotsford and Langley are still hovering in a seller’s market with 4.5 months of inventory. A balanced market is considered anywhere between 5 and 8 months of inventory.
IF we look at the different types of homes, in all regions, single family homes are significantly in the balanced market. Condos and Townhomes remain in a seller’s market condition in Abbotsford, Langley and Chilliwack whereas in Mission this segment of housing is in a Buyer’s market.
Months of Inventory are a strong indication of how robust the market is.
- 0 to 5 months of inventory = "seller's market".
- 5 and 8 months of inventory = "Balanced Market".
- More than 8 months of inventory = "Buyer's Market".
Analysis of the historical data suggests downward pressure on home prices occurs when the ratio rises above 8 months of inventory for a sustained period, while home prices often experience upward pressure when it dips below 5 over several months.
ABBOTSFORD

The average price for all residential properties in Abbotsford is down 1.0% over the prior month but up 0.8% compared to the same month last year.
DETATCHED HOMES
Sales of single-family detached homes in this month reached 51. This is fairly similar to 48 from the prior month 54 the same month last year. The average sales price for these properties in Abbotsford was $1,119,341 which is down 5.6% from the prior month but up 1.4% compared to the same month last year.
We saw 144 new detached home listings this month which is similar to 148 last month and up from 110 compared to the same month last year.
Active listings were at 409, which is down from 450 last month but up from 387 the same month last year.
TOWNHOMES AND ROWHOMES
The average sales price was $688,194, up 4.8% from last month and 16.9% from last year.
We saw 34 of these types of homes sell this month. This is down from 41 the prior month but up from 32 the same month the prior year.
There were 49 new Townhome listings this month which is down from 74 last month and from 67 last year.
The month ended with 104 active listings which is down from 121 last month and from 178 this month last year.
CONDOS AND APPARTMENTS
The average price of these homes is $428,270 down 6.9% from last month and up 9.4% compared to last year.
64 of these types of homes sold this month compared to 69 last month and 59 last year.
We saw 99 new listings this month compared to 104 last month and 93 last year.
We ended the month with 158 active listings compared to 188 last month and 263 the same month last year.
CHILLIWACK

The average price for all residential properties in Chilliwack this month is down 2.5% compared to last month but up 4.9% compared to the same month last year.
DETATCHED HOMES
Sales of single-family detached homes this month reached 87 down from 111 last month and up from 56 last year.
We saw 304 new detached home listed this month compared to 312 last month 281 last year.
Active listings were at 663 at the end of the month compared to 608 the previous month and 919 the same month last year.
The average sales price for detached properties in Chilliwack was $868,420 which is down 8.6% from the prior month and down 6.1% compared to the same month last year.
TOWNHOMES AND ROWHOMES
We saw 40 of these types of homes sell this month compared to 46 last month and 28 last year.
There were 79 new Townhome listed this month compared to 78 last month and 88 last year.
The month ended with 117 active listings compared to 107 last month and 221 this month last year.
The average sales price was $640,950, up 4.2% from last month and 9.6% from last year.
CONDOS AND APPARTMENTS
41 of these types of homes sold this month compared to 32 last month and 24 last year.
We saw 56 new listings this month compared to 66 last month and 83 last year.
We ended the month with 173 active listings compared to 175 last month and 201 last year.
The average price of these homes is $360,415 down 13.1% from last month and 11.8% compared to last year.
LANGLEY

The average sale price for all residential property types in Langley was down 1.4% over the prior month but still up 6.3% compared to the same month last year.
DETATCHED HOMES
The average sales price for detached properties in Langley was $1,573,372 which is up 3.4% from the prior month and up 11.9% compared to the same month last year.
Sales of single-family detached homes this month reached 62 down from 77 last month and similar to 61 last year.
New listings this month reached 152 which is down from 185 last month but up from 141 compared to last year.
Active listings were at 436 at the end of the month which was similar to 449 last month and slightly up from 408 compared to the same month last year.
TOWNHOMES AND ROWHOMES
The average sales price was $860,617, up 8.6% from last month and 12.9% from last year.
There were 58 town homes sold this month compared to 53 both last month and last year.
There were 100 new listings for Townhomes listed this month down from 114 last month and up from 86 last year.
The month ended with 154 active listings compared to 148 last month and 191 this month last year.
CONDOS AND APPARTMENTS
The average price of these homes is $558,389 which is down 4.5% from last month and 0.4% compared to the same month last year.
There were 74 condos sold this month compared to 85 last month and 62 last year.
New listings this month at 162 were similar to 165 last month slightly down from 173 compared to last year.
The month ended with 284 active listings compared to 285 last month and 332 last year.
MISSION

The average price for all residential properties in Mission is currently $825,443. This represents a 3.0% decrease over the prior month and a 5.9% decrease compared to the same month last year.
DETATCHED HOMES
The average sales price for detached properties in Mission was $879,257 which is down 6.1% from the prior month and 5.9% compared to the same month last year.
Sales of single-family detached homes this month reached 36 which is up from 32 the prior month and 26 the same month last year.
We saw 71 new listings this month compared to 100 last month and 60 the same month last year.
Active listings were at 243, compared to 260 from the prior month and 279 the same month last year.
TOWNHOMES AND ROWHOMES
The average price of these attached units is $697,450. This represents a 6.1% decrease over the prior month and a 3.8% decrease compared to the same month last year.
We saw 4 of these types of homes sell this month which was the same number as the prior month and up from 2 the same month the prior year.
We saw 14 new listings this month which is down from 17 last month and up from 2 compared to the same month last year.
Active listings were at 38, compared to 40 last month and 20 the same month last year.
CONDOS AND APPARTMENTS
The average sale price of these homes last month was $350,333. This represents a 25.8% decrease from the prior month and 20.4% over last year the same month. The limited sales of these homes are responsible for the big swings in the average sold price.
There were 3 condos sold last month, down from 5 the prior month and up from 1 the same month last year.
There were 8 new listings last month, down from 11 the prior month and up from 5 the same month last year.
Last month ended with 33 active listings compared to 50 the prior month and 28 the same month last year.
Buying or Selling? Free home valuation and/or consultation
I look forward to working with you and helping you reach your home ownership goals. Reach out to get in touch and start the process today. I offer:
