
May 2026 Market Report: Abbotsford & Chilliwack
Executive Summary:
May 2026 closed with a story that almost nobody is telling: this market has split in two.
Detached homes and townhomes are firming. Sales have climbed every month since February, March and April sales actually beat the same months last year, and detached inventory is running well below 2025 levels in both regions. Condos are moving the other way. Sales are falling even though inventory hasn’t surged, and Chilliwack condos are now in an official buyer’s market at 8.7 months of inventory.
In other words, the buyer’s market everyone felt this winter hasn’t ended. It has concentrated into one property type.
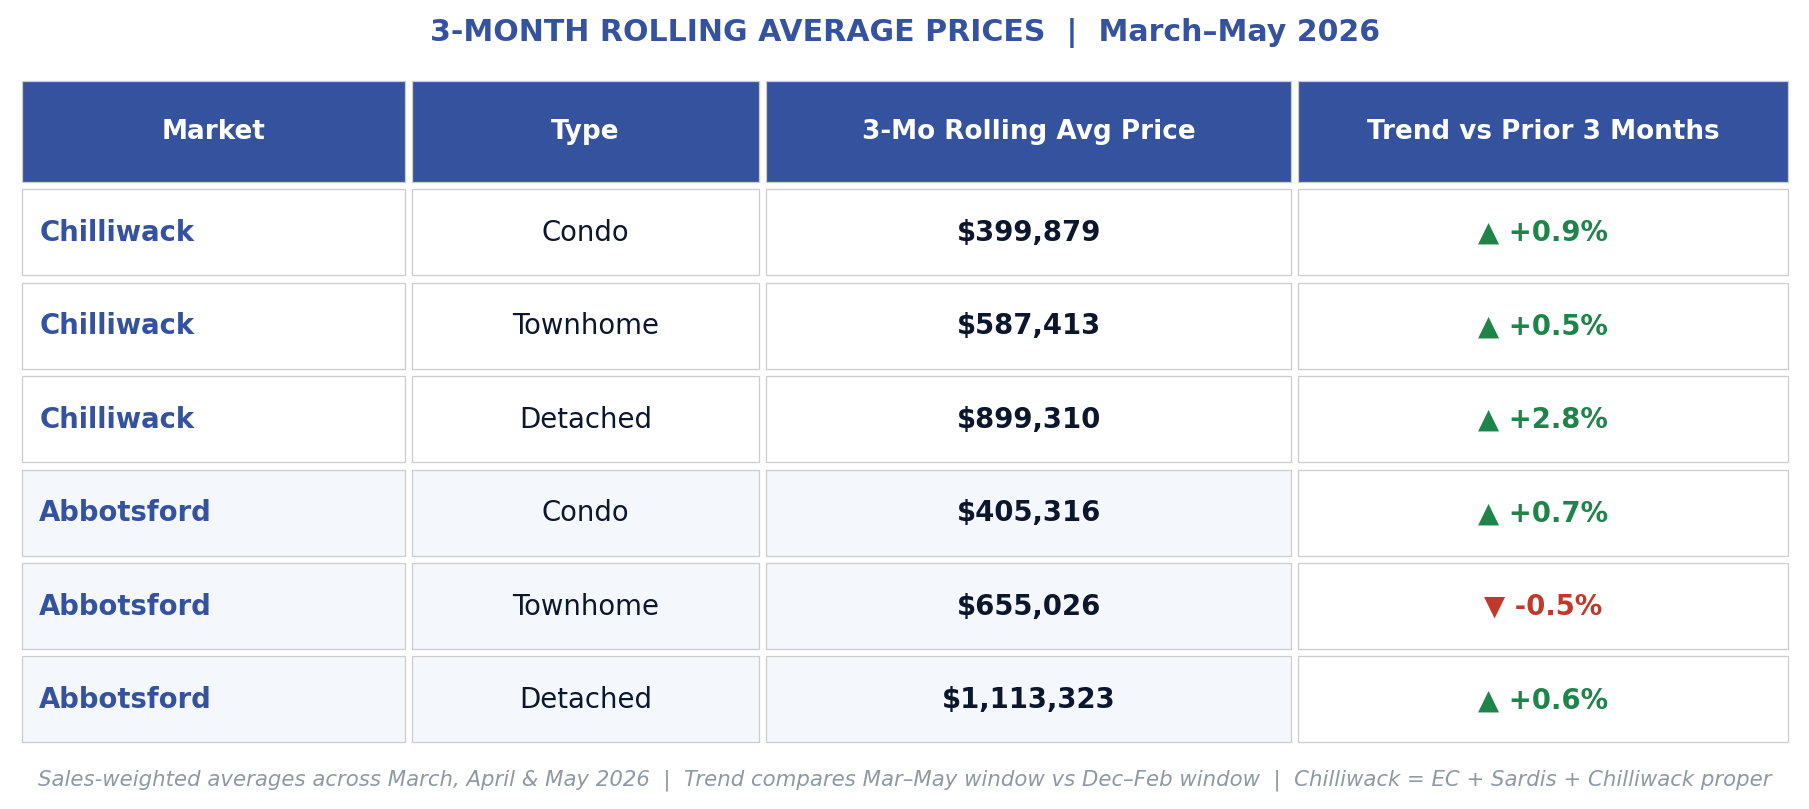
Prices support the firming side of that story. Using the 3-month rolling average through May 2026, detached homes in Abbotsford are trending at $1,113,323. Chilliwack detached homes are trending at $899,310. Both figures are up slightly from the Feb to Apr rolling average, which signals that the price floor established through late 2025 and early 2026 may be holding. The market isn’t running up. But it isn’t sliding either.
The macro backdrop matters more than usual. The Bank of Canada held its overnight rate at 2.25% on June 10 for the fifth consecutive time. The best 5-year fixed rates are sitting around 4.04% to 4.15%. Variable rates start at 3.35%. These are real, workable numbers for most buyers. CIBC and BMO both expect no further rate changes in 2026. If you have been waiting for rates to fall further before making a move, the evidence suggests you may be waiting for something that is not coming this year.
The honest headline: which market you’re in depends entirely on what you’re buying or selling. House and townhome sellers are in better shape than the headlines suggest. Condo buyers hold more cards than they may realize. The rest of this report breaks down exactly where the lines sit.
Market Gauge:
All MOI calculations use a strict 3-month rolling average: average active listings for March, April, and May divided by average monthly sales over those same three months. This approach uses complete calendar months and smooths the natural bounce of any single month.
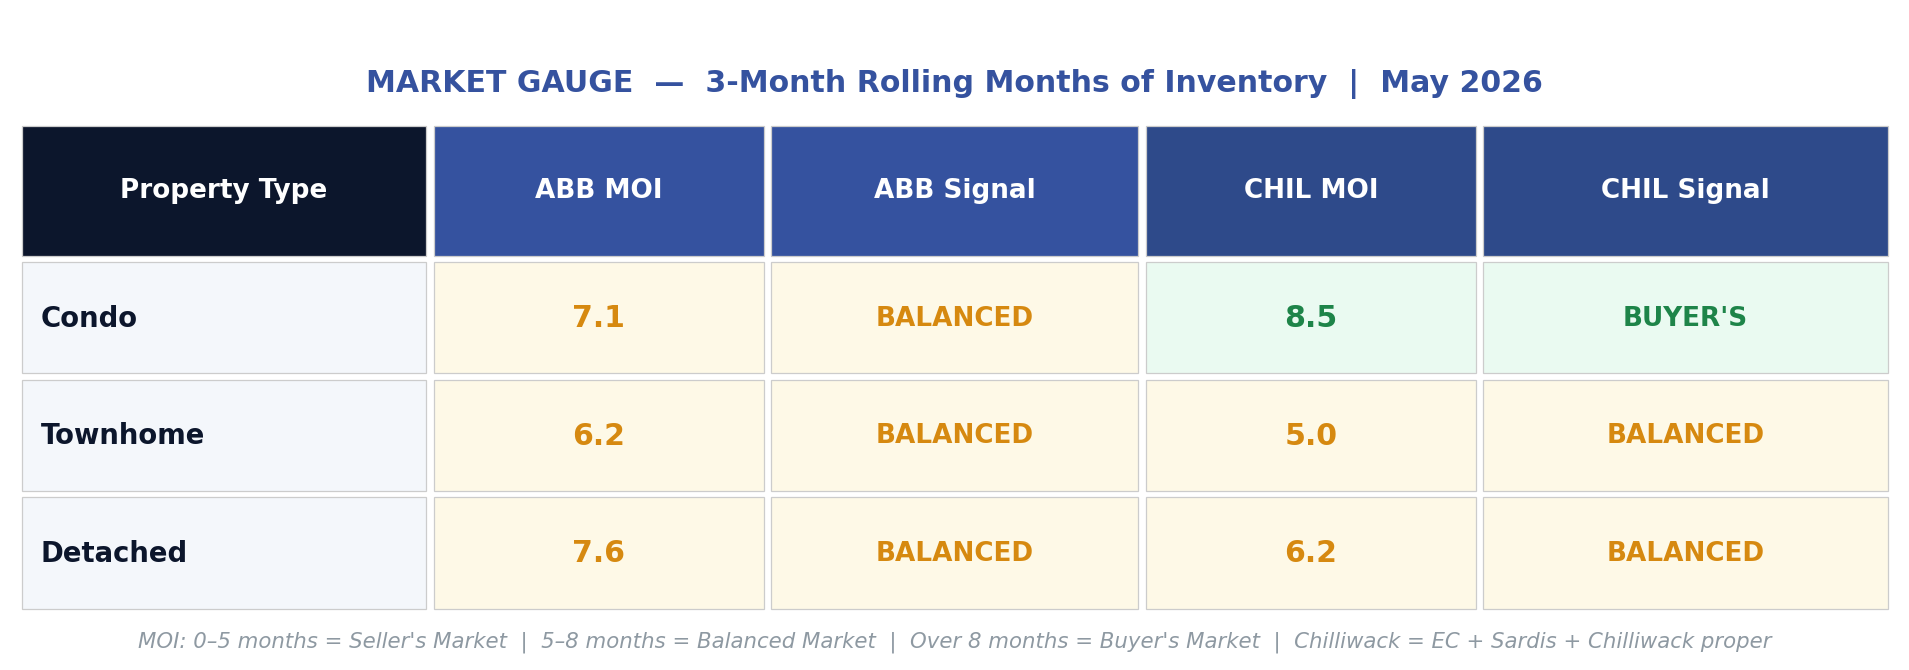
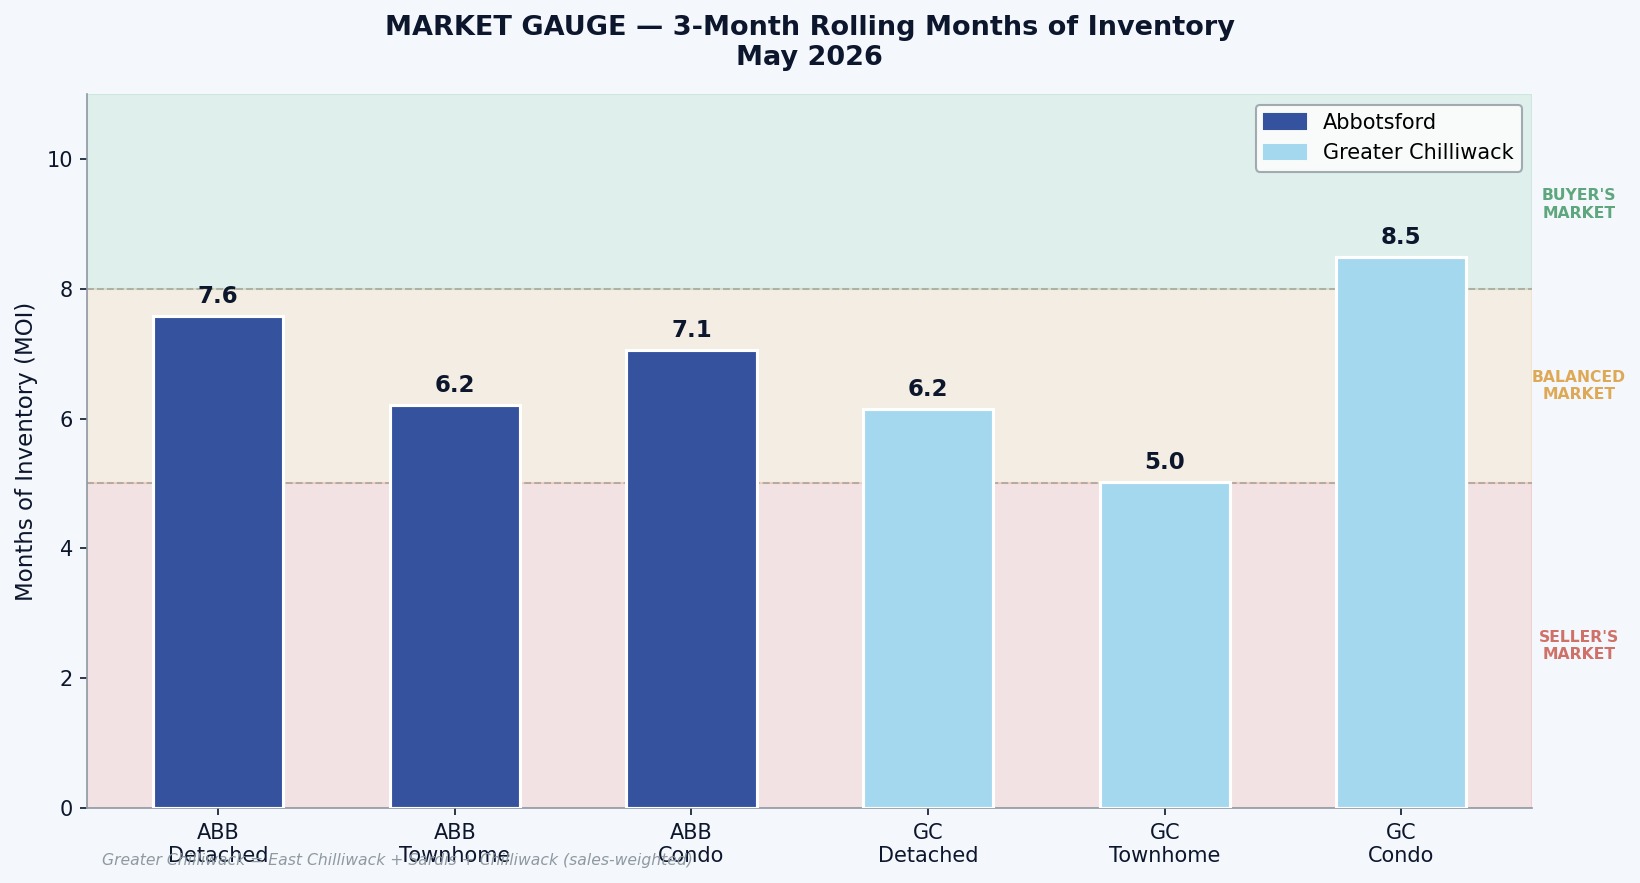
One number deserves a closer look. Chilliwack townhomes sit at 5.0 months, the tightest segment in either region. The April single-month reading actually dipped to 4.88, briefly touching seller’s market territory. No other segment on this board can say that. Demand in that segment is absorbing higher inventory levels and then some.
And one trend deserves a warning. Abbotsford condos read as balanced at 7.2 months on the rolling average, but only because a strong March is still holding the average down. The single-month readings went from 5.5 months in March to 7.8 in April to 9.0 in May. More on that in the Caution Zone.
WHAT ARE PRICES DOING
Rather than highlight a single month’s number, let’s look at where the rolling trend line has been moving across all four recent 3-month windows.
Detached Homes
Abbotsford: The rolling average moved from $1,148,653 (Dec to Feb) down to $1,101,044 (Jan to Mar), held at $1,106,527 (Feb to Apr), and now sits at $1,113,323 (Mar to May). That pattern, a dip in early 2026 followed by a modest recovery, suggests the market found a floor around $1.1M and is stabilizing. Prices are not running up, but the slide that started in mid-2025 appears to have stopped. The recovery in the most recent window lines up with the sales firming you’ll see in the Spotlight section below. Prices and volume are telling the same story.
Chilliwack: The rolling average moved from $885,517 (Dec to Feb) to $885,767 (Jan to Mar), then dipped slightly to $874,682 (Feb to Apr) before recovering to $899,310 (Mar to May). That recovery in the most recent window is meaningful. Chilliwack detached homes showed more life in April and May than the winter months suggested they would.
Townhomes
Abbotsford: The rolling average declined from $656,465 (Dec to Feb) to $642,898 (Jan to Mar), then partially recovered to $652,372 (Feb to Apr) and $653,251 (Mar to May). Essentially flat-to-slightly-soft for six months. Not a price collapse, but no upward momentum either. Worth noting: townhome sales volume has climbed sharply since February, so if that demand holds, prices have support under them.
Chilliwack: The trend shows a dip from $577,572 (Dec to Feb) to $558,565 (Jan to Mar) and a clearer recovery since, now at $587,413 (Mar to May). Chilliwack townhomes have shown more recovery momentum than Abbotsford townhomes over the spring, which fits with this being the tightest segment in the report.
Condos
Abbotsford: Condos have been remarkably stable: $395,815 (Dec to Feb), $405,954 (Jan to Mar), $404,546 (Feb to Apr), $407,219 (Mar to May). Essentially flat for six months, oscillating in a narrow $10K range. But read that stability carefully. It has held while sales volume fell two straight months and monthly inventory readings climbed fast. Stable prices on falling demand is a tension that doesn’t usually last.
Chilliwack: Similar stability: $380,934 to $399,879 across four rolling windows. The Chilliwack condo market has more inventory relative to sales than any other segment right now, and sales are running roughly 31% below last spring, yet prices have held. The gap between weak demand and stable prices will narrow. Either buyers will step in or prices will drift. Worth watching.
Key takeaway on prices: The trend line across all property types and both regions is best described as stabilizing. The sharp corrections of late 2025 have not continued into spring 2026. Prices are not climbing, but they are not falling either. That is the foundation a buyer or seller needs to make a confident decision.
UNDERSTANDING INTEREST RATE:
FIXED VS VARIABLE
There is a common misunderstanding worth clearing up, because it affects how buyers think about timing.
The Bank of Canada controls variable rates. When the Bank of Canada raises or lowers its overnight rate, it directly moves the prime rate at Canadian banks. Prime is currently 4.45%. Variable-rate mortgages are priced relative to prime, typically at prime minus a discount. A variable rate today runs around 3.35% to 3.50%. If the BoC cuts or raises, your variable rate moves with it, usually within a day or two.
Bond markets control fixed rates. Five-year fixed mortgage rates are tied to Government of Canada 5-year bond yields, not to the Bank of Canada overnight rate. Banks take the bond yield and add a spread of roughly 1% to 2% to cover risk and profit. The 5-year GoC bond yield currently sits around 3.1%, which is why the best 5-year fixed rates are in the 4.04% to 4.15% range. Bond yields move based on global market sentiment, inflation expectations, and economic data, independently of what the BoC decides on any given announcement day.
This matters for your planning. The BoC holding or cutting will help variable rates, but it will not automatically bring down your 5-year fixed rate. To get lower fixed rates, you need bond yields to fall. With Middle East energy prices keeping inflation elevated and yields drifting higher, fixed rates may not improve much in 2026 and could edge slightly higher. That is why locking in today’s 4.04% is a defensible choice for buyers who want certainty.
WHO THE MARKET IS BEST FOR
Downsizers
If you are thinking about downsizing, the timing conversation just got more interesting. On the selling side, you are no longer selling into a sliding market. Detached sales have climbed three straight months, detached inventory is running about 17% below last May in Abbotsford and 16% below in Chilliwack, and rolling prices ticked up in the most recent window. Your home is still worth less than it was at the 2022 peak. That is real, and it would be wrong to pretend otherwise. But the floor appears to be in, and buyer traffic is returning.
Now look at the other side of the move. If you are stepping from a detached home into a condo, you are buying in the softest segment this market has. Chilliwack condos are in an official buyer’s market, condo sales there are down roughly 31% from last year, and Abbotsford condos are trending the same direction fast. You would be selling on the firming side of the market and buying on the soft side. That sequencing rarely lines up this cleanly. You have time, selection, and negotiating room on your purchase, with improving conditions behind your sale.
The equity picture also deserves a clear look. If you bought your home before 2020, you have still built meaningful wealth. Abbotsford detached homes at their 2016 average price of $634,000 are now trending at $1,113,000 on a rolling basis. That is roughly 75% appreciation over a decade, even after the correction from the 2022 peak. The move still makes financial sense for most long-term owners. It just does not look like it did at the top of the market.
Empty Nesters
The specific scenario many empty nesters are navigating right now is selling a detached home and purchasing a townhome or condo that is easier to maintain, with some equity freed up for retirement or to help the next generation. With the detached side firming and the condo side softening, this market is as close to ideal for that transition as it has been since before the pandemic.
One nuance worth knowing: the townhome and condo sides are not the same right now. Chilliwack townhomes are the tightest segment in the report at 5.2 months, so expect less negotiating room there. Condos are where your buying leverage is strongest. The right target depends on your lifestyle, but the leverage map matters when you write the offer.
The caveat worth naming: presentation still matters. A well-priced, well-presented home moves quickly in this market. A home that feels like a project is going to sit, even with detached supply below last year. If your home needs work before listing, that conversation is worth having early.
Upsizers
Upsizing in this market is a genuinely different experience than it was two years ago, and the spring shifted the calculus again. You are selling without the windfall you might have expected, and buying without the desperation you would have faced. But take note: the segment you are buying into, detached, has been firming since March. The “wait, it will keep softening” plan looks weaker every month. If the fundamentals are right for your family, the data no longer rewards waiting.
The financial reality check: an Abbotsford detached home at the current rolling average of $1,113,323 with 20% down carries a mortgage of roughly $890,000. At 4.04% over 25 years, that is approximately $4,700 per month. Run your own numbers carefully before stretching. This market still gives you time to do that math properly, which is exactly the kind of time buyers did not have in 2021.
Investors
The rental market picture has changed meaningfully, and any honest investor briefing has to acknowledge it. Nationally, advertised rents fell to a 33-month low in February 2026 after 17 consecutive months of declines. The reason is direct: Canada’s population shrank in 2025 for the first time since Confederation, driven by a dramatic policy-driven reduction in international students and temporary foreign workers. The federal government cut temporary resident admissions aggressively, and that population had been a primary driver of rental demand in urban centres.
That softening is showing up in our condo data in real time. Condo sales in Chilliwack are down roughly 31% from last spring, and Abbotsford condo sales have fallen two straight months, even though condo inventory in Abbotsford is actually 11% below last year. This is a demand story, not a supply story. The investor buyer pool has stepped back because the rental math got harder. For the buyers still standing, this is the most leverage available in any segment of this market.
The Fraser Valley is more insulated than Metro Vancouver. Vancouver’s vacancy rate reached 3.7% in late 2025. Abbotsford median rents dropped roughly 3% year-over-year as of March 2026. Those are softer numbers than anyone was projecting two years ago, but they are not a collapse.
The longer-term case for this region still has merit, but it requires honest underwriting. Do not model rental income at 2023 levels. Do not assume immediate positive cash flow. Build in a vacancy buffer. The investor who buys smart in a soft market tends to do very well when that market recovers. But the math has to work at today’s rents, not the rents you are hoping for.
One additional dynamic worth watching: new residential construction has largely stalled. CMHC reports zero concrete condo tower launches in Metro Vancouver in Q1 2026. Presale activity across BC is at multi-decade lows. Developers are cancelling and delaying projects across the region. When demand eventually recovers, whether through population growth resuming or rate-driven buyer confidence returning, supply will not be ready to meet it. That is a long-term structural argument for property values in this region. It does not help your cash flow today, but it supports the hold thesis.
First-Time Buyers
The window you have been waiting for is open right now, but it is not open evenly across the market, and that matters for your strategy.
If you are shopping for a condo, you may be the only buyer in the room. Take your time. Negotiate. Subjects and inspections are normal again, and sellers are waiting. A condo in Chilliwack at the rolling average of $399,879 with a 5% down payment of $20,000, financed with CMHC insurance at 4.04%, carries a monthly payment of roughly $2,080. That is real money, but it is also entry into ownership at maximum leverage.
If you are shopping for a townhome or stretching toward a detached home, move with more urgency. Those segments have been firming since March. As I have shown clients recently, stretching slightly into a home with a rentable suite can produce a lower effective monthly cost than a smaller purchase, depending on the suite income. The math is worth working through together.
One important note from the economists: CIBC expects no change to the BoC policy rate for the rest of 2026. BMO agrees. The rates you are waiting to improve are likely at their floor for this cycle. If you are waiting for a better entry point, the data suggests you may already be in one.
SPOTLIGHT - THE DETACHED HOME SEGMENT
Detached homes drive the conversation in this market. They carry the most equity, involve the largest decisions, and connect directly to the downsizer-upsizer cycle that defines so much of Fraser Valley real estate. And this spring, they are the segment quietly telling a different story than the headlines.
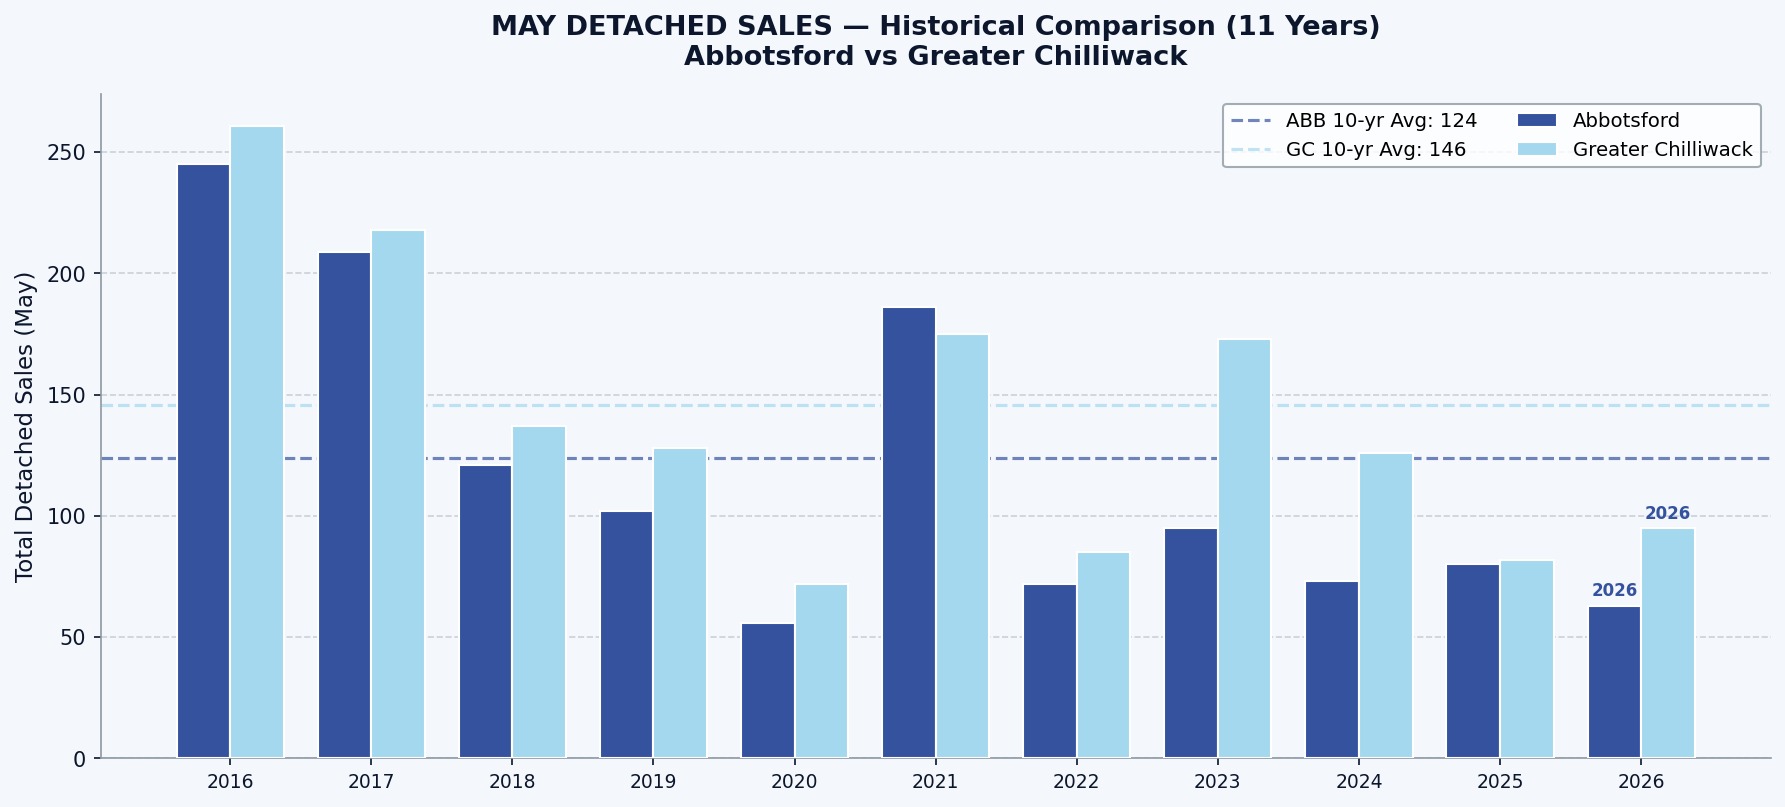
The trend matters more than the level: Abbotsford recorded 63 detached sales in May 2026 against a 10-year May average of 124, so volume is still low by historical standards. But the direction has changed. Sales have risen three months straight, and March and April both beat the same months last year. Chilliwack recorded 95 combined detached sales in May, noticeably higher than May 2025’s 82. Something genuinely improved in the detached market through the spring.
Demand is rising while supply isn’t: Active detached listings in Abbotsford are running about 17% below last May, and Chilliwack is down 16%. When sales climb for three months while inventory runs below last year, that is a firming market by definition.
The ratio confirms it: The Abbotsford detached sales-to-active ratio has climbed from 8.5% in January, which was genuinely buyer’s market territory, to 13.2% in May, which is balanced and rising. If the market felt like a buyer’s market to you this winter, you weren’t wrong. For houses, it briefly was one. It isn’t anymore, and the trend since March has been one-directional.
A note on days on market: This report does not use days on market as a key metric, because it is not a reliable indicator. Listings are routinely pulled and re-listed, which resets the clock entirely. What looks like a 15-day sale may have been on the market for 60 days across two listing cycles. December seasonally distorts the data further, as many sellers de-list over the holidays and re-list in January or February. Active listings, sales volume, and MOI give you the cleaner read.
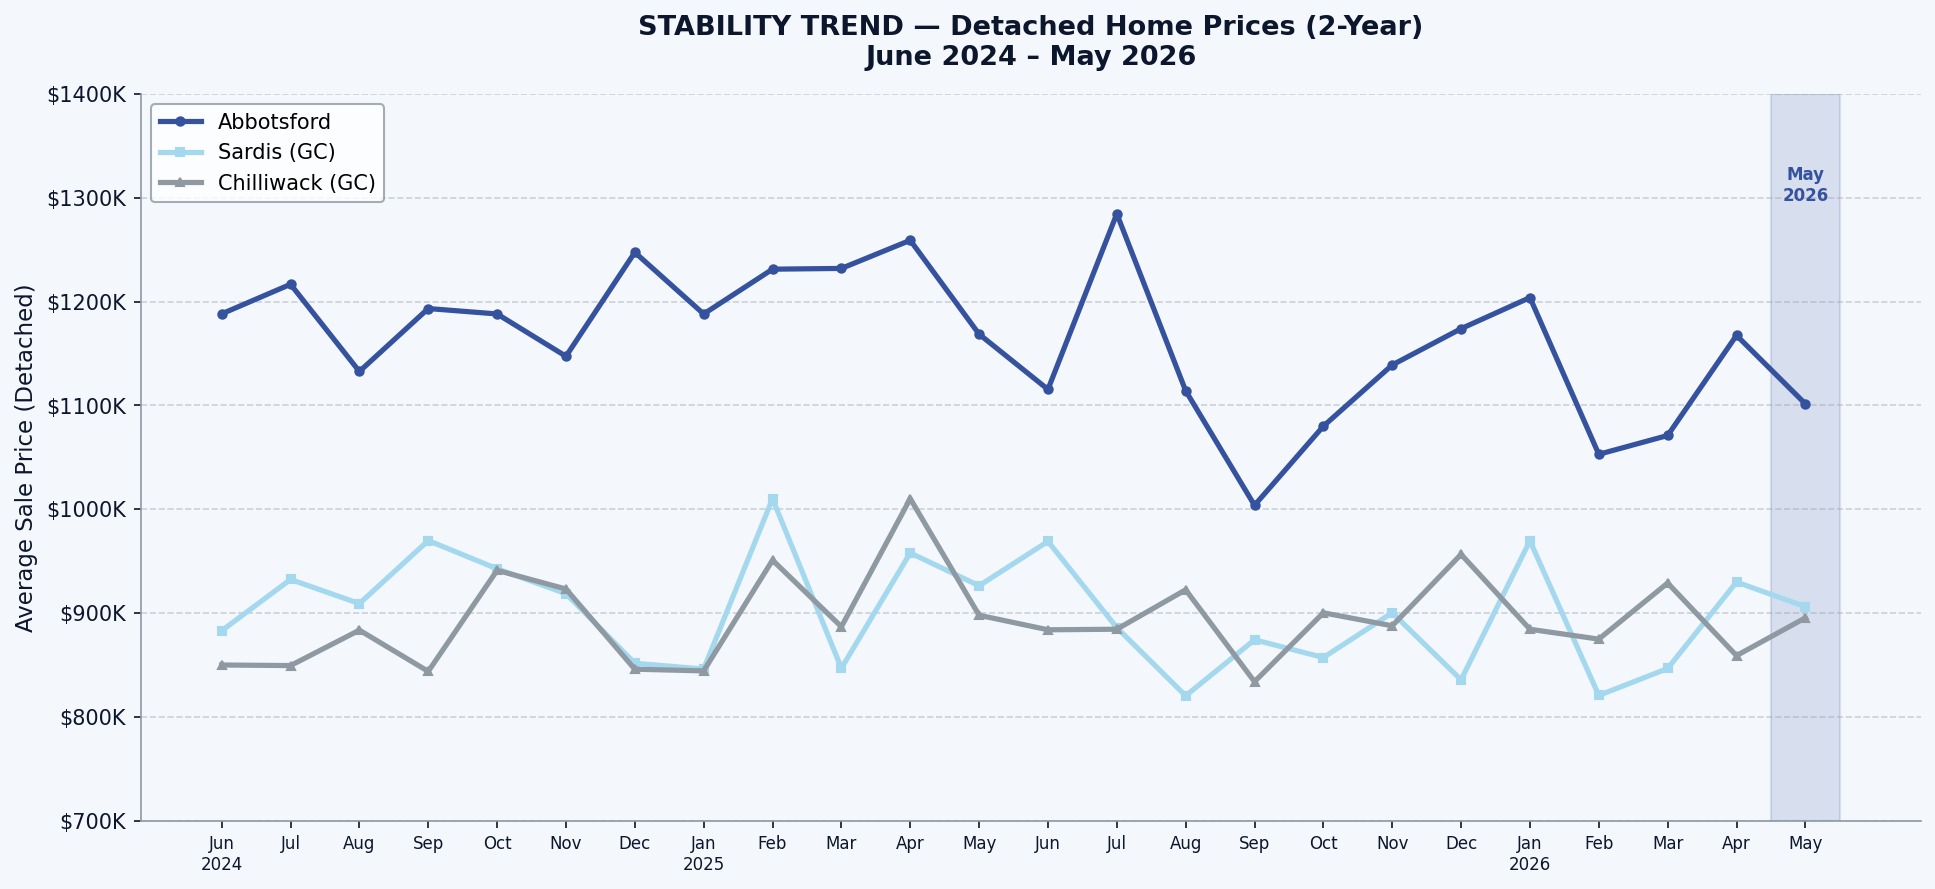
STABILITY TREND
The 2-year price chart below uses monthly reported averages from June 2024 through May 2026. Read it alongside the rolling average trend table above for the clearest picture.
What the chart shows: Abbotsford detached prices reached their recent peak around April to May 2025 and have since settled into a range roughly $100K to $150K below that peak. The range over the past 12 months, approximately $1.0M to $1.28M, reflects a market that is volatile month to month but directionally stable at around $1.1M on a rolling basis.
Chilliwack prices tell a similar story. Sardis and Chilliwack proper have been trading in a band from roughly $820K to $970K over the past year. The floor appears to have been set around Q4 2025.
For sellers: the softness you are feeling versus the 2022 peak is real, but the worst of the correction appears to be behind you, and spring demand is confirming it. For buyers: you are not buying at the bottom of a straight-line decline. The market has been searching for a floor, and there is now evidence on both the price side and the sales side that it has found one.
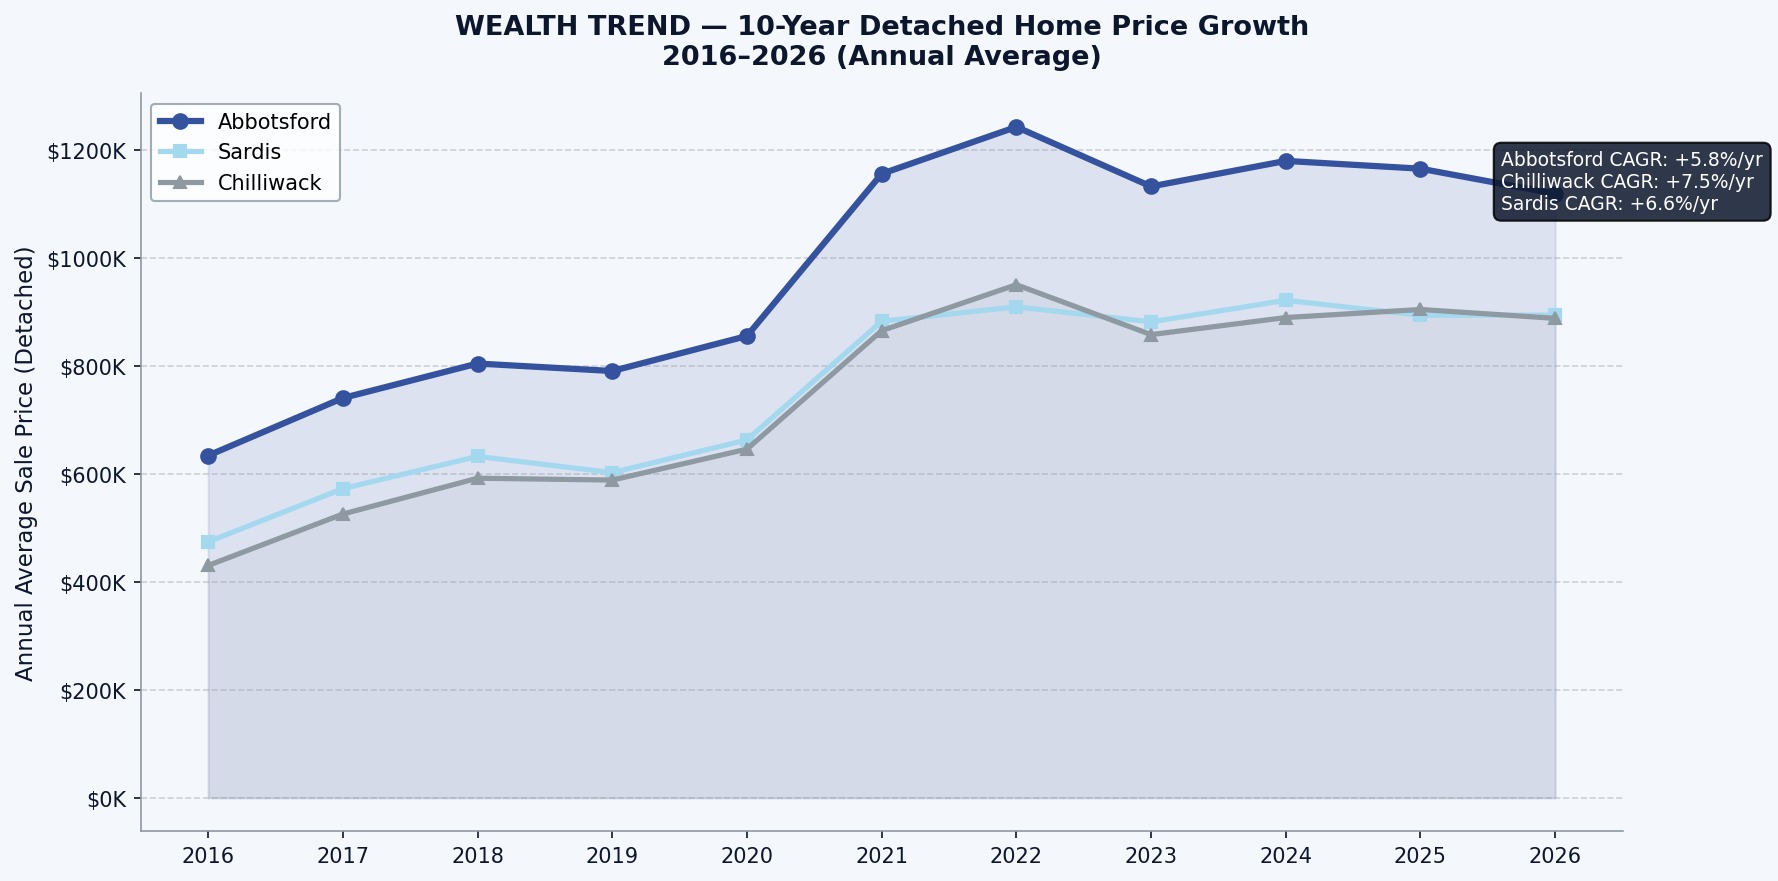
WEALTH TREND
Real estate in the Fraser Valley has been one of the most consistent long-term wealth builders available to ordinary Canadians. The 10-year chart uses annual average sale prices to show the full growth picture through cycles of boom and correction.
Abbotsford detached CAGR 2016 to 2026: +5.8% per year. Annual average prices moved from $634,192 in 2016 to $1,119,339 in 2026. Even after the correction from the 2022 peak, the 10-year return is strong.
Chilliwack detached CAGR 2016 to 2026: +7.5% per year. Chilliwack started at a lower base ($430,570 in 2016) and compounded harder as affordability-driven demand from Metro Vancouver flowed east along the corridor.
Sardis CAGR 2016 to 2026: +6.6% per year. Consistent growth through every cycle.
The important context for buyers today: you are entering at prices roughly 12% to 15% below the 2022 peak on an annual-average basis. You are not buying at the top. You are buying into a market that has a 10-year track record of meaningful appreciation, at a point where the correction appears to have run its course.
INVESTOR INSIGHTS:
RATE SENSITIVITY & MARKET DYNAMICS
On June 10, 2026, the Bank of Canada held its overnight rate at 2.25% for the fifth consecutive meeting. Prime rate sits at 4.45%. Best insured 5-year fixed rates are around 4.04% to 4.15%. Best variable rates start around 3.35%.
On the rental market: The Fraser Valley rental market is softer than it was two years ago. Abbotsford median rents declined approximately 3% year-over-year through March 2026. The driver is a national one: Canada’s population shrank in 2025 for the first time since Confederation, losing over 100,000 residents as the federal government aggressively cut international student and temporary worker admissions. Temporary residents at their peak represented 7.6% of Canada’s population. The government is targeting that figure below 5% by end of 2027.
Where the softness shows up locally: Look at the condo segment. Chilliwack condo sales are down roughly 31% year-over-year, and Abbotsford condo sales have declined two straight months even with inventory below last year. The investor and entry-level buyer pool that drives condo demand has thinned. This is the rental softness translating directly into resale market behaviour.
The local vs national distinction: Toronto and Vancouver vacancy rates hit 3.0% and 3.7% respectively in late 2025, reflecting the concentrated impact of international student departures near major universities and colleges. The Fraser Valley sees this effect, but more moderately. Smaller markets with less exposure to international student housing are experiencing milder softening. Do not benchmark your Abbotsford rental projections against headlines about Toronto.
When does rental demand recover? The temporary resident drawdown is a finite policy action. Once Canada reaches its 5% target (expected end of 2027), permanent resident intake continues at 365,000 per year. Population growth is projected to resume, modestly, in 2028. RBC and Oxford Economics both project a return to modest growth beyond 2027. The rental softness you are experiencing is real and is not over yet, but it has a visible end date.
The supply story working in your favour: New construction has stalled significantly. CMHC reports that condominium presales across BC hit multi-decade lows in 2025 and early 2026. Business in Vancouver reported zero concrete high-rise launches in Metro Vancouver in Q1 2026. Developers are cancelling and delaying projects at a rate not seen since 2008. When demand recovers, supply will not be ready to absorb it. This is the structural long-term argument for property values in this region.
Rate sensitivity for investors: With the BoC on hold and most economists projecting no further cuts in 2026, variable rates are near their floor. Five-year fixed rates face modest upward pressure from bond yields. If you are financing an investment property, today’s 4.04% five-year fixed rate may represent the best fixed-rate opportunity of this cycle.
MACRO OUTLOOK
Bank of Canada: The overnight rate holds at 2.25% after five consecutive pauses. The BoC is navigating two competing pressures: headline inflation at 2.8% in April (driven by Middle East energy prices) against a weak economy with GDP contracting in Q1 2026 and only modest recovery expected. Core inflation came in at 2.1% in April, which is the number the BoC watches most closely. The central bank is effectively looking through the energy-price spike, choosing not to raise rates to fight an inflation driven by war rather than by a hot domestic economy. The BoC projects inflation hovering near 3% before easing back to the 2% target in 2027.
Fixed vs variable rate outlook: Remember that fixed rates follow bond yields, not the BoC directly. The 5-year GoC bond yield sits around 3.1%, up from 2.80% at the start of 2026 as Middle East tensions pushed yields higher. Most forecasters see yields in a 3.0% to 3.5% range through 2026 with an upward bias. This means 5-year fixed mortgage rates could drift toward 4.5% by year-end, not fall. Variable rates will track the BoC and are unlikely to move much in either direction this year.
Canadian economy: GDP contracted in Q4 2025 and grew only weakly in Q1 2026. May’s labour report surprised with 88,000 new jobs, suggesting the economy has not rolled over entirely. BoC projects GDP growth at 1.2% this year and 1.7% next year. Not strong, but not recessionary. US trade policy uncertainty continues to weigh on business investment.
Population and immigration: This is the story with the most direct impact on housing demand over the next two years. Canada lost over 100,000 residents in 2025, the first annual population decline since Confederation. This was deliberate policy. The government cut temporary resident intake sharply to reduce the proportion of temp residents from a peak of 7.6% of the population toward a target of 5% by end of 2027. Permanent resident targets continue at 365,000 per year through 2027. Once the temporary resident drawdown completes, population growth is expected to resume at a more sustainable pace. The housing market is currently pricing in the demand reduction. It is not yet pricing in the supply reduction that follows from stalled construction.
Mortgage renewal cliff: Approximately 33% of Canadian mortgage holders face higher monthly payments upon renewal by year-end 2026. Most are 5-year fixed borrowers from the low-rate era of 2021 to 2022 who are rolling into today’s rates. Payment increases average around 20%. This is a real affordability pressure that will continue to influence both buyer demand and listing activity through 2027 as holders reassess whether to sell.
CAUTION ZONE
Every market report worth reading has to be honest about where the risks sit.
Watch Abbotsford condos: The single-month inventory readings went from 5.5 months in March to 7.8 in April to 9.0 in May. The rolling average still reads balanced at 7.2, but only because March’s strong month is holding it down. On the current trajectory, this segment officially crosses into a buyer’s market next month. You read that call here first.
The condo softness is a demand story, not a supply story: Abbotsford condo inventory is actually 11% below last year, yet sales have fallen two straight months. Chilliwack condo sales are down roughly 31% from last spring. The listings didn’t flood in. The buyers left, largely because softening rents made investor math harder. If you are selling a condo, your competition isn’t other listings so much as the absence of buyers. Condition, staging, and pricing precision matter more than they have in years.
Inventory is rising, but unevenly: Total Abbotsford listings are up sharply since December, but most of that is the normal spring build, and the composition matters. Detached supply is actually 17% below last May. The real supply story is townhomes in Chilliwack, where inventory has stepped up to a structurally higher level than early 2025. So far, demand there has absorbed it and then some, but it is the segment to watch if sales cool.
Bond yield risk: If the Middle East conflict escalates further or inflation proves stickier than expected, 5-year fixed mortgage rates could drift toward 4.5% to 4.9% by year-end. That would compress purchasing power and cool demand further, including the detached recovery this report highlights. It is not the base case, but it is a real possibility worth factoring into purchase decisions.
The rental softness window: If you are an investor relying on rental income to service debt, be conservative with your projections. Rents are down nationally and regionally. The population-driven recovery is real but is 18 to 24 months away at minimum. Your cash flow model needs to work at today’s rents, not projected future rents.
Developer stall and future supply: The short-term effect of stalled construction is a market with rising resale inventory but fewer new builds coming. Medium-term, this constrains supply and supports prices when demand returns. It is both a caution and an opportunity, depending on your time horizon.
READY TO TALK NUMBERS?
Whether you are thinking about downsizing, helping your kids get into the market, or just want to know what your home is worth in this split market, I am here to help you think it through. No pressure, just honest numbers.
Buying or Selling? Free home valuation and/or consultation
I look forward to working with you and helping you reach your home ownership goals. Reach out to get in touch and start the process today. I offer:
